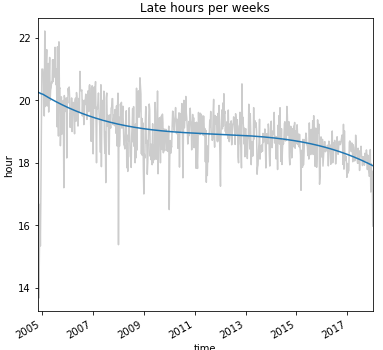
In this blog post / notebook, we want to take a look at how much information you can extract from a simple Git log output. We want to know where the developers come from, on which weekdays the developers don’t work, which developers are working on weekends, what the normal working hours are and if the is any sight of overtime periods…
Developers’ Habits (IntelliJ Edition)

